
Imagine trying to drink from a firehose. That’s what handling live cryptocurrency data feels like. Prices change every second, new coins emerge, and market caps swing by billions in minutes. If you’re just downloading a CSV every morning, you’re already 24 hours behind the traders, the algorithms, and the truth.
In this walkthrough, we’re not just sketching a diagram. We’re engineering a full, production-grade analytics pipeline in Microsoft Fabric. We’ll pull live data from the CoinMarketCap API, land it without losing a single record, track exactly what we’ve ingested with a metadata watermark, and transform it through a Medallion Architecture (Bronze, Silver, Gold) until it’s powering sharp, real-time Power BI dashboards.
“Yesterday’s data is a history lesson. Today’s data is a competitive advantage.”
Why Micorsoft Fabric?
Microsoft Fabric is a unified, cloud-native analytics platform that brings together data ingestion, storage, transformation, and live BI all in one place, with zero infrastructure to manage.

Three things make it stand out for this kind of pipeline:
- Unified Platform: One SaaS surface for ingestion, lakehouse storage, notebooks, and BI. No tool sprawl.
- Delta Lake Native: Open Parquet/Delta format with ACID transactions, schema evolution, and time travel.
- DirectLake Mode: Power BI reads Delta files directly, no import, no DirectQuery lag, sub-second queries.
We’ll tackle the hard stuff head-on:
- How do you handle a full historical load without duplicating data?
- How do you switch to incremental loads seamlessly?
- How do you stream data without your costs spiraling out of controls?
Let’s turn a chaotic stream of JSON into business-ready intelligence.
The Architecture: Data Sources to Dashboards
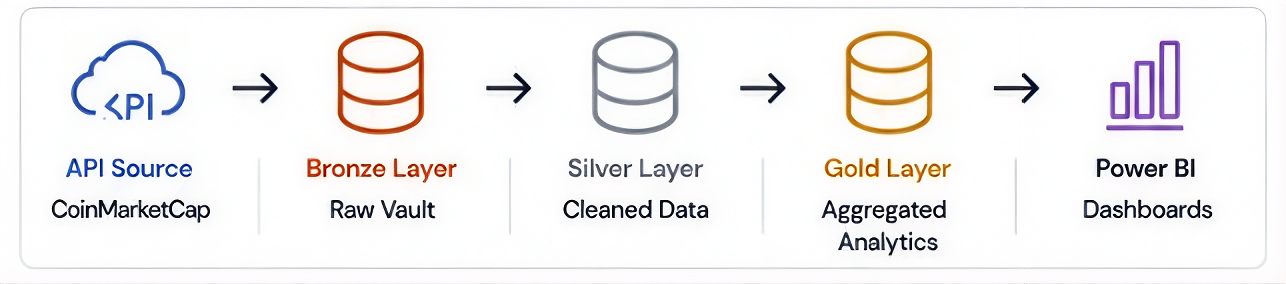
This pipeline follows the Medallion Architecture the industry standard for scalable, reliable data engineering:
- Bronze Layer (Raw): Data lands exactly as it comes from the API. No transformations, full fidelity, always reprocessable.
- Silver Layer (Cleaned): Validated, deduplicated, and schema-enforced. Ready for analytical use.
- Gold Layer (Curated): Aggregated KPIs optimised for Power BI dashboards, SQL Views, and ML Models.
Step 1: Configure the CoinMarketCap API
The CoinMarketCap API provides two key endpoints.
The /v1/cryptocurrency/listings/latest endpoint returns the top N coins by market cap with price, volume, and 24-hour percentage change. The /v1/global-metrics/quotes/latest endpoint provides total market cap and BTC/ETH dominance for dashboard KPI tiles.
Authentication is handled via an API key stored securely in Azure Key Vault never hard-coded and injected into the pipeline through a Fabric Linked Service.
Step 2: Ingest with Fabric Data Factory
Create a new workspace with Fabric F2 capacity and set up a Lakehouse called CryptoLakehouse. Inside a new Data Factory pipeline, a Web Activity calls the CMC API with your key injected from Key Vault. A Copy Activity lands the raw JSON into the Bronze layer, partitioned by date: Files/crypto_raw/{YYYY}/{MM}/{DD}/data.json.
Set a scheduled trigger every hour with 3 retries at 30-second intervals. This handles rate-limit responses gracefully. Monitor all runs from the Fabric Monitor Hub.
Step 3: Transform Through Medallion Layers with PySpark
A Fabric Notebook running PySpark reads raw Bronze JSON, flattens nested quote fields, enforces data types, and writes through the layers:
- Bronze → Silver: Validate, deduplicate, enforce schema.
- Silver → Gold: Aggregate KPIs: price, market cap, 24h volume, percentage change.
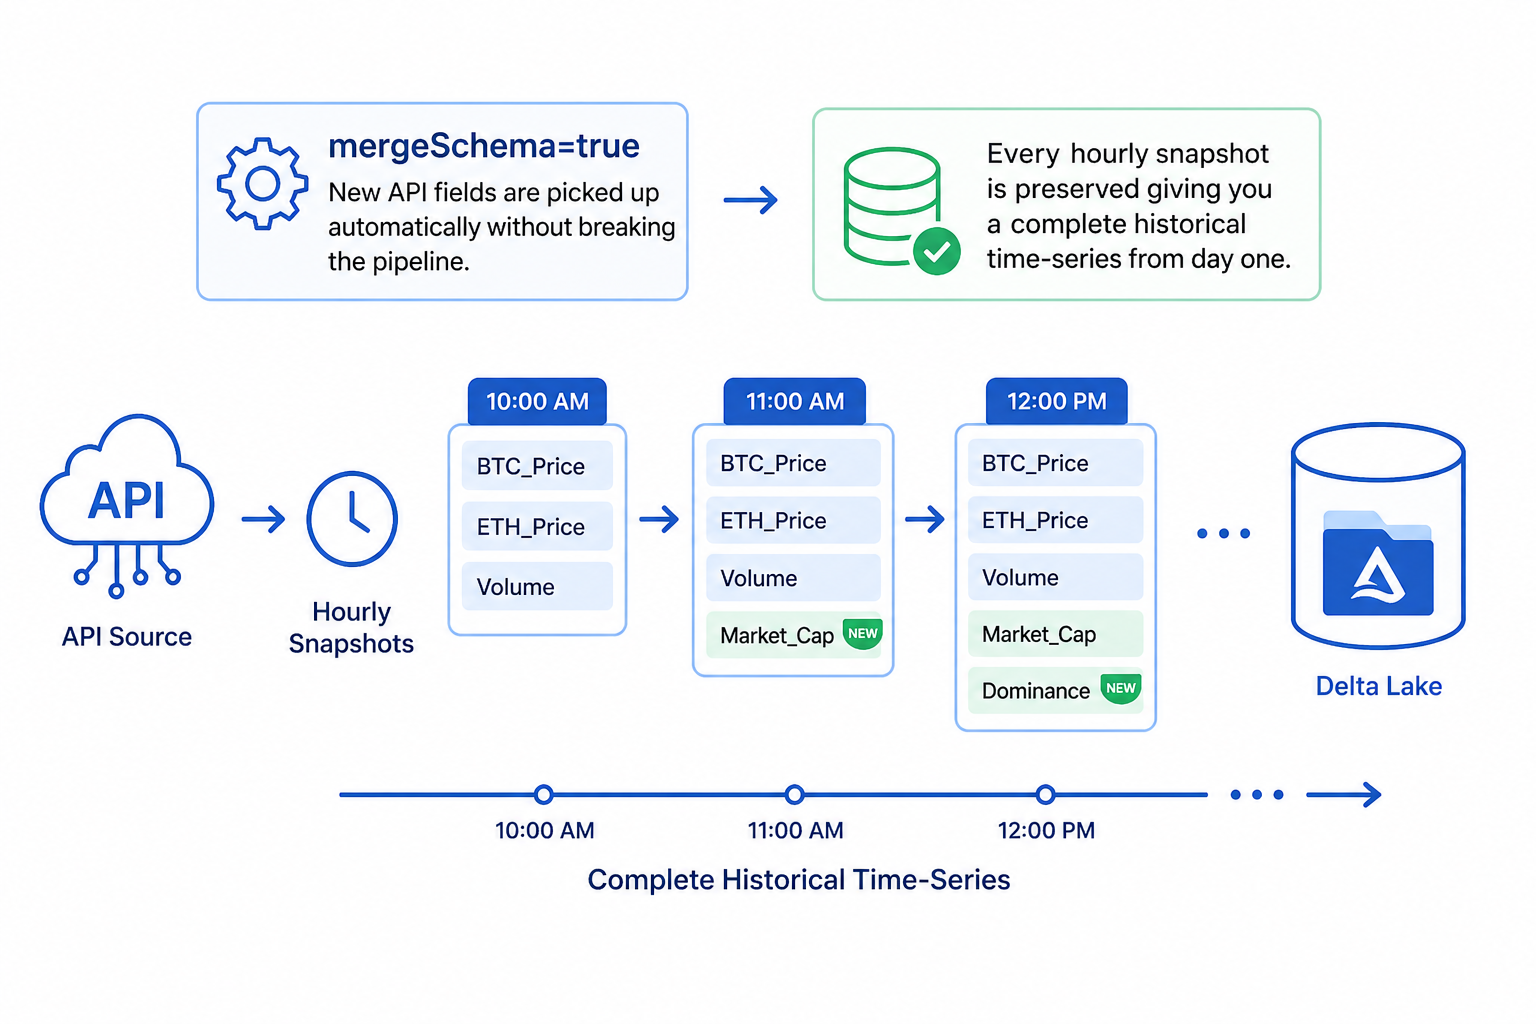
The mergeSchema=true option means new API fields are picked up automatically without breaking the pipeline. Every hourly snapshot is preserved giving you a complete historical time-series from day one.
Step 4: Visualise with Power BI DirectLake
The Lakehouse automatically creates a T-SQL read endpoint zero configuration. Connect Power BI via Get Data → Microsoft Fabric → Lakehouse → DirectLake mode.
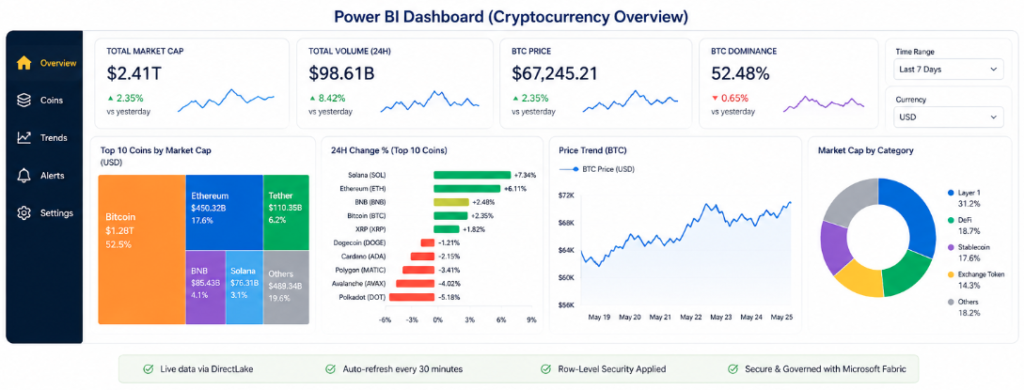
Build your visuals: KPI cards for price and market cap, treemap for top coins by cap, bar chart for 24-hour change %, and a line chart for price trend over time.
Publish to the Fabric workspace, configure scheduled refresh, and apply row-level security before sharing with stakeholders.
Production Best Practices
- API Key Security: Store in Azure Key Vault, inject via Fabric Linked Service. Never hard-code.
- Incremental Loads: Partition by date, use Delta MERGE to upsert and prevent duplicates.
- Schema Evolution:
mergeSchema=truehandles new API fields without breaking the pipeline. - Monitor & Alert: Fabric Monitor Hub tracks all runs. Set failure email alerts.
- Retry Logic: Web Activity retries=3, interval=30s handles CMC 429 rate-limit responses.
- Governance: Apply Fabric Data Domains and sensitivity labels for compliance.
Key Takeaway
This pipeline is fully cloud-native and zero-infrastructure:
- CoinMarketCap REST API → Fabric Data Factory → Lakehouse (Delta) → PySpark Notebook → Power BI DirectLake.
- Microsoft Fabric eliminates operational overhead while delivering enterprise security, governance, and real-time analytics from startup to Fortune 500, at any scale.