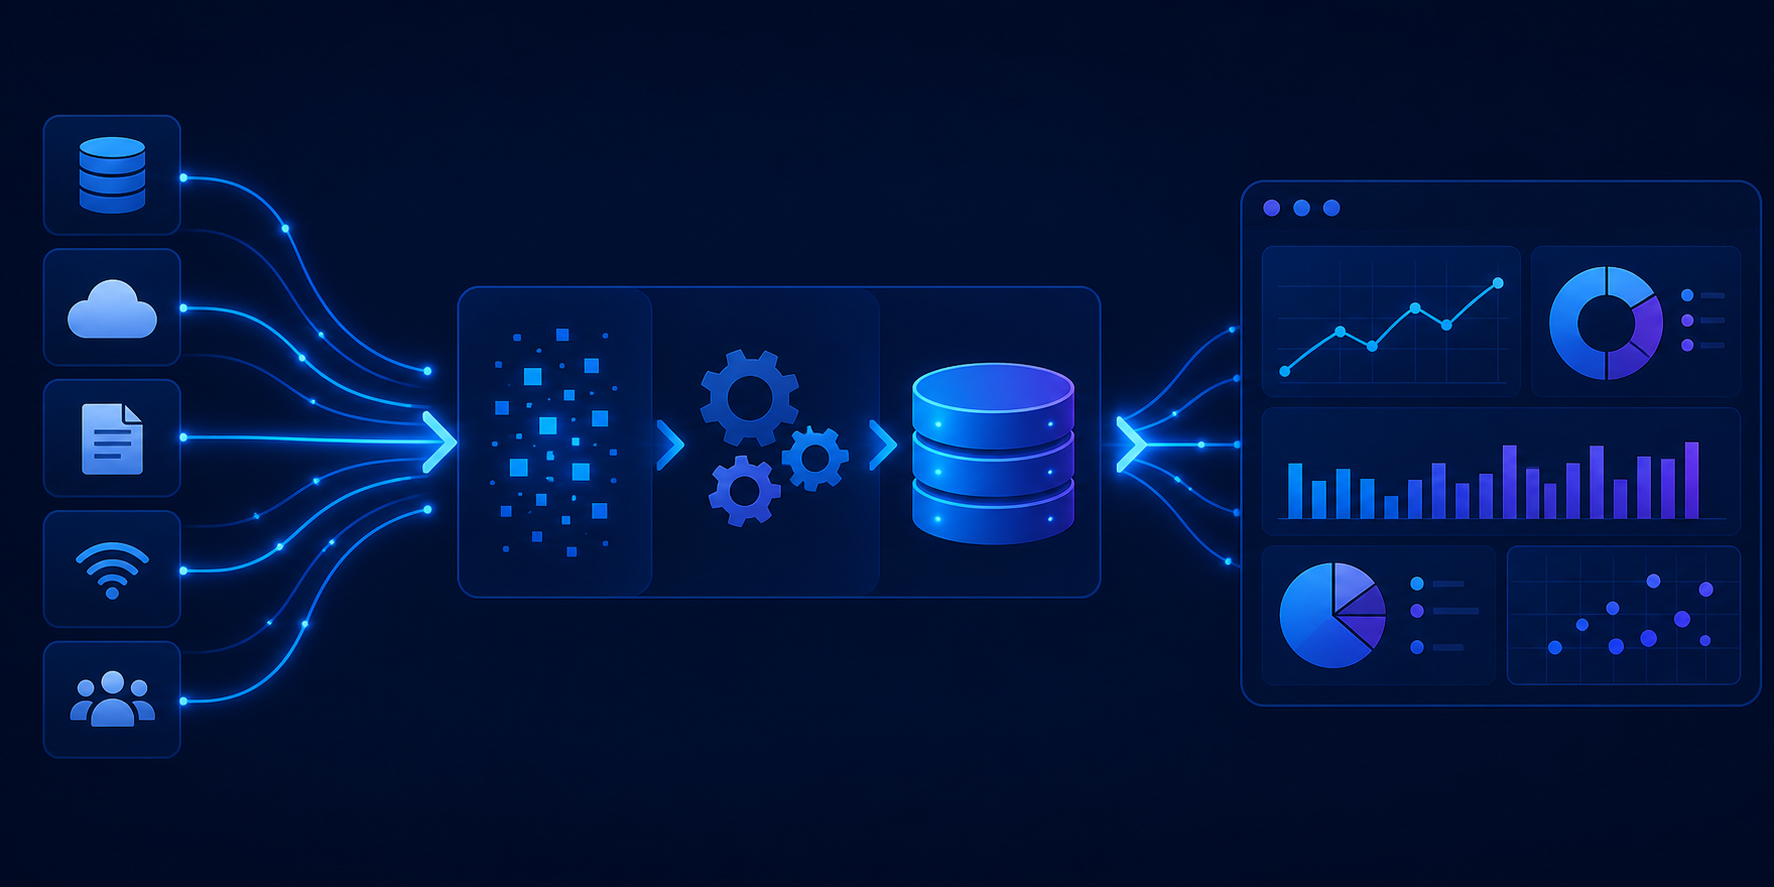
Microsoft Fabric allows you to build a complete data pipeline within a single environment. Instead of managing multiple tools, you work inside one workspace where data is ingested, processed, stored, and analyzed.
“Data systems become valuable when every step from
ingestion to insight is clearly defined and repeatable.”
Insight
This guide walks you through a practical, step-by-step approach to building a structured data pipeline that transforms raw data into business-ready insights.
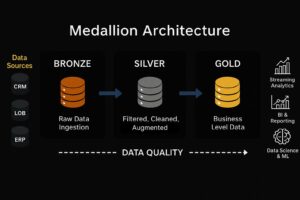
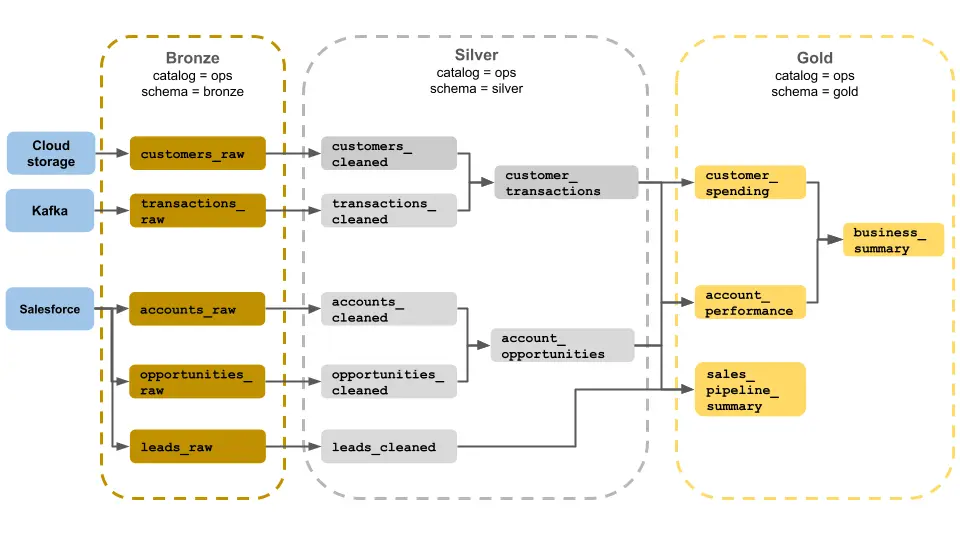
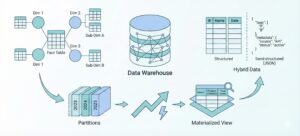
Understanding the Architecture
The system follows a clear flow:
Source → Bronze → Silver → Gold → Power BI
Each layer has a specific role. Keeping these layers separate ensures your data remains organized, scalable, and easy to manage.
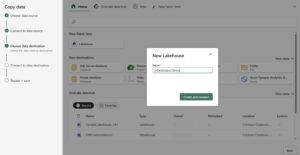
Step 1: Create Workspace and Lakehouse
Start by setting up your working environment in Microsoft Fabric.
Create a new workspace, then create a Lakehouse inside it. This Lakehouse will act as the central location where all your data is stored and processed.
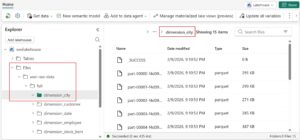
Inside the Lakehouse, you will work with two main areas:
Files: Used for raw data storage
Tables: Used for structured and processed data.
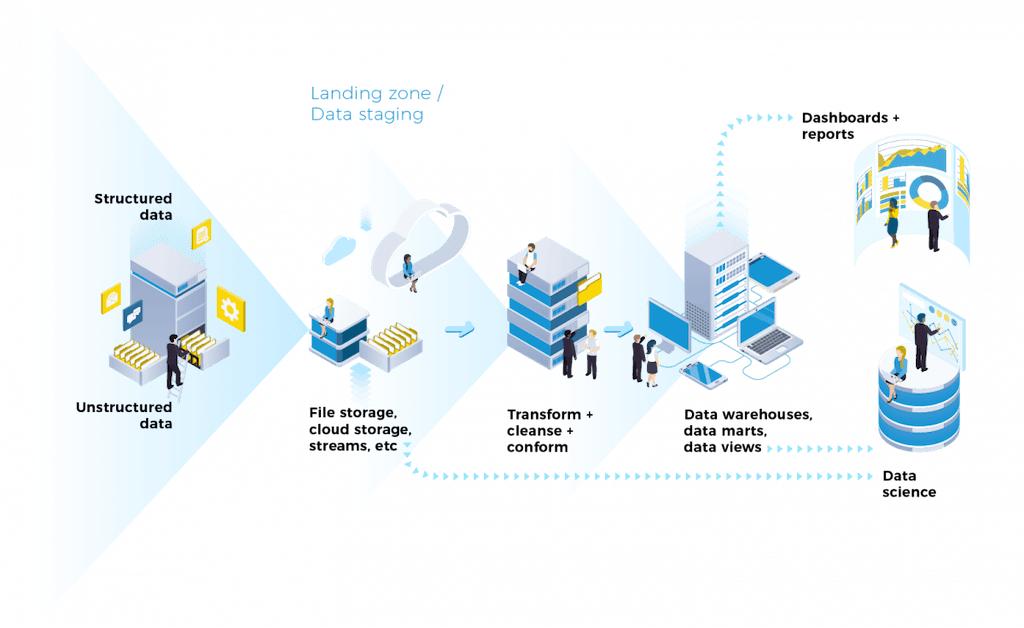
Step 2: Ingest Data
Upload your data into the Lakehouse. This can include CSV files, Excel files, JSON data, or connections to databases and APIs.
At this stage, do not modify the data. The goal is to capture it exactly as it exists in the source system.
Step 3: Create Bronze Layer
Organize your raw data by creating a Bronze layer.
Create a folder such as bronze/ inside the Files section and store all raw data there.
This layer should remain unchanged and act as a backup for all incoming data.
Step 4: Create Notebook for Processing
Open a new Notebook in Fabric using the PySpark environment. This is where you will begin transforming your data.
Example: Load data from Bronze layer
df = spark.read.option("header", "true").csv("Files/bronze/sales.csv")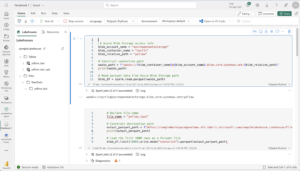
Step 5: Build Silver Layer (Data Cleaning)
Clean and standardize your data to make it usable.
Handle missing values
df = df.fillna(0)Remove duplicates
df = df.dropDuplicates()Fix data types
from pyspark.sql.functions import col
df = df.withColumn("Amount", col("Amount").cast("double"))
Rename columns
df = df.withColumnRenamed("sales_amt", "SalesAmount")Save the cleaned data into the Silver layer:
df.write.mode("overwrite").saveAsTable("silver_sales_data")Step 6: Create Gold Layer (Business Logic)
Now transform cleaned data into business-ready insights.
Example: Aggregation
from pyspark.sql.functions import sum
gold_df = df.groupBy("Region").agg(sum("SalesAmount").alias("TotalSales"))
Save Gold layer:
gold_df.write.mode("overwrite").saveAsTable("gold_sales_summary")This layer is optimized for reporting and fast queries.
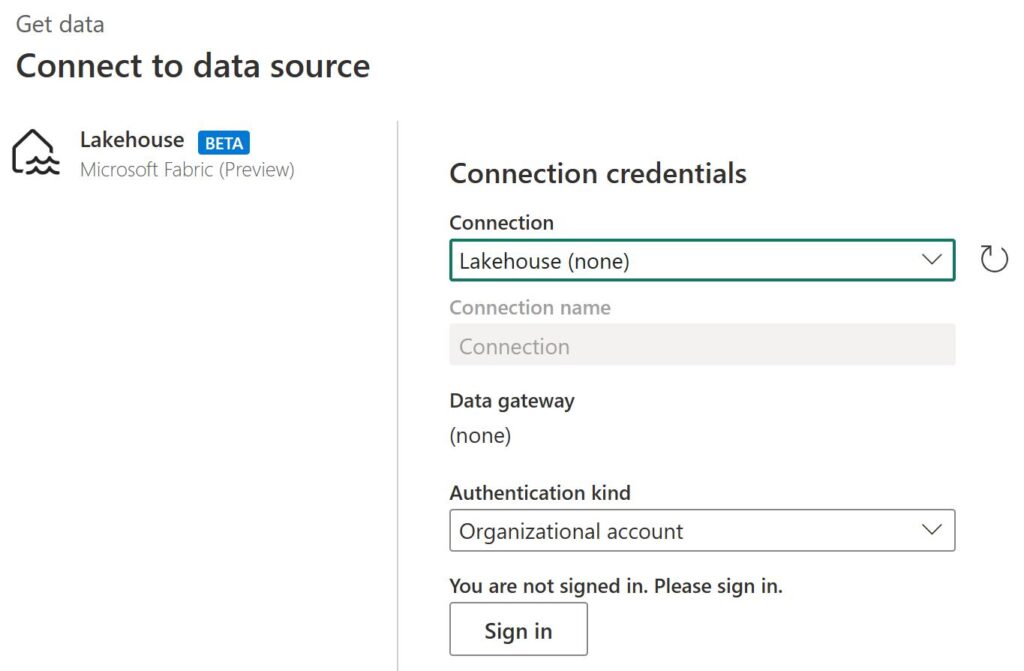
Step 7: Connect Power BI (Direct Lake)
Connect your Gold layer to Power BI for visualization.
Select your Fabric Lakehouse and use Direct Lake mode to enable real-time data access without refresh delays.
Create dashboards, charts, and KPIs directly from your Gold tables.
Step 8: Automate the Pipeline
Create a Data Pipeline in Fabric to automate the workflow.
Include steps such as data ingestion, notebook execution, and data movement. Use parameters to reuse pipelines efficiently.
Step 9: Implement Incremental Loading
Instead of processing all data repeatedly, configure incremental loading to process only new or updated records.
This improves performance and reduces compute cost.
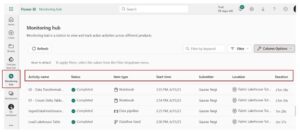
Step 10: Add Monitoring and Alerts
Configure alerts for pipeline failures using email or Teams notifications.
This ensures that issues are detected and resolved quickly.
Step 11: Optimize Performance
Apply optimization techniques such as Z-Ordering and V-Order to improve query performance.
OPTIMIZE gold_sales_summary
ZORDER BY (Region)
This helps dashboards load faster and improves overall efficiency.
Step 12: Apply Security and Governance
Implement Role-Based Access Control (RBAC) to manage user permissions.
Use managed identities and service principals for secure data access.

Key Takeaway
Building a scalable data system is about following a clear structure.
When data flows from raw to clean to business-ready layers, the entire system becomes easier to manage, scale, and optimize.
Microsoft Fabric enables this process within a unified environment, making it possible to build production-grade data pipelines efficiently.