
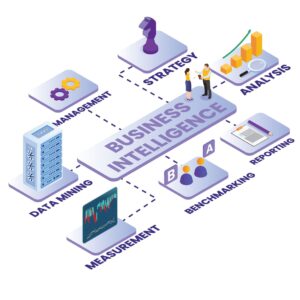
Overview
Modern organizations generate data from multiple systems, but without structure, that data remains underutilized.
“Data becomes valuable when it moves beyond reporting and starts driving decisions.”
Insight
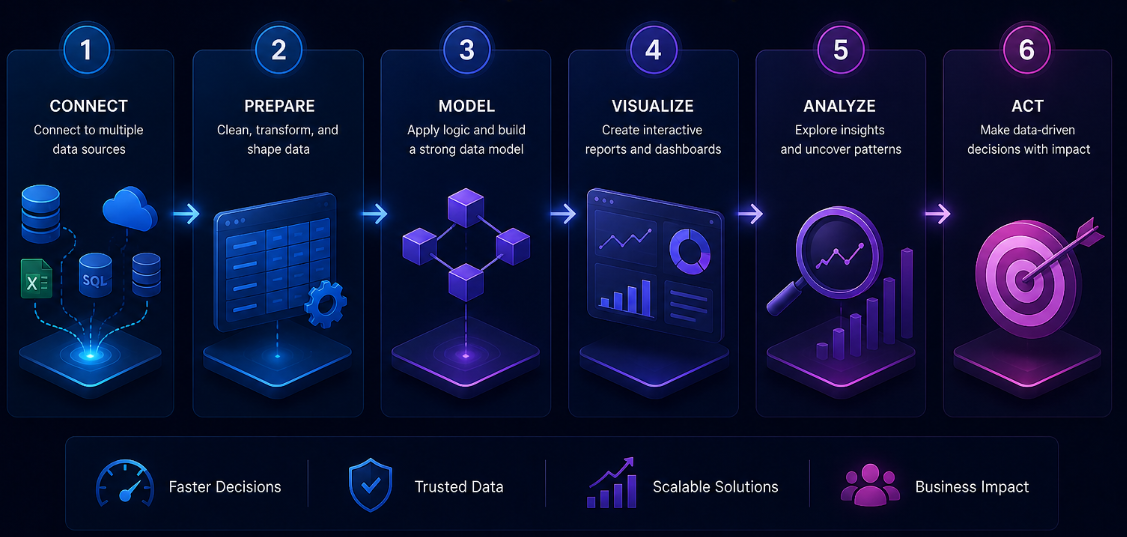
Power BI provides a complete framework to connect, process, and visualize data in a way that supports real decision-making. Instead of working with disconnected reports, businesses can build a unified system where data flows continuously from source to insight.
This case study outlines how that system is designed and implemented.

Data Sources and Integration
Every analytics system begins with data collection. In this setup, data is gathered from multiple sources, including Excel files, SQL databases, and APIs.
Each source serves a different purpose. Excel files often contain operational or manual data, SQL databases store structured transactional data, and APIs provide dynamic or external inputs.
The key objective at this stage is not just to collect data, but to ensure it can be consistently integrated into a single pipeline. Without proper integration, analysis becomes fragmented and unreliable.

Data Transformation and Preparation
Raw data is rarely ready for analysis. It often contains inconsistencies, missing values, or incompatible formats.
Using Power Query, the data is cleaned and transformed into a structured format. This includes standardizing columns, removing errors, and aligning data types.
This step is critical because it establishes the foundation for all future calculations. Clean data ensures that insights generated later are accurate and trustworthy.
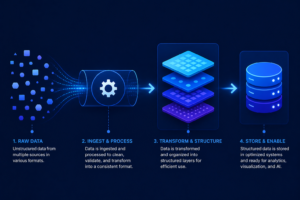
Data Modeling and Structure
Once the data is prepared, it is organized into a model that defines how different datasets relate to each other.
Relationships are created between tables to connect relevant information. Measures and calculations are then defined to represent key business metrics.
This stage transforms raw data into a structured system where logic can be applied. Without proper modeling, even clean data cannot produce meaningful insights.

Analytical Logic with DAX
At the core of the system lies DAX (Data Analysis Expressions), which powers the calculations behind the reports.
Key metrics are defined using DAX, such as total revenue, profit margin, product ranking, and year-over-year growth.
These calculations go beyond basic aggregation. They allow dynamic analysis, enabling users to filter, compare, and explore data in real time.
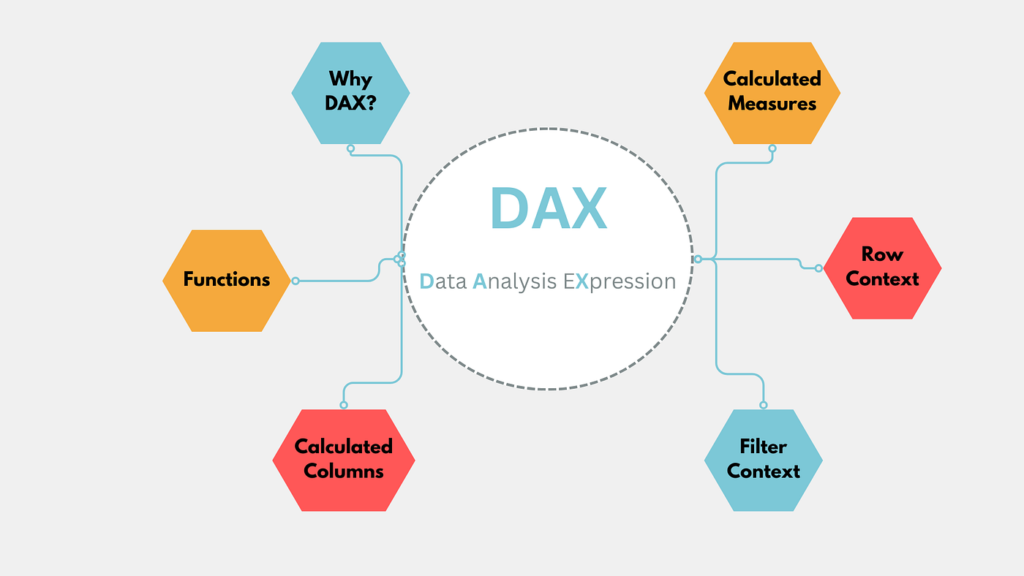
DAX acts as the intelligence layer of the system, turning structured data into actionable insights.
Visualization and Reporting
Once the data model and calculations are in place, the information is presented through interactive dashboards.
Visual elements such as charts, tables, and KPIs are used to communicate insights clearly. Instead of reviewing raw numbers, users can quickly understand trends, performance, and patterns.
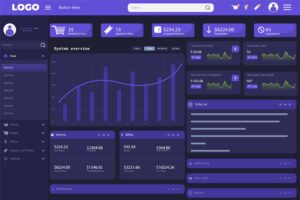
The goal of visualization is not just to display data, but to make it easy to interpret and act upon.
Deployment and Accessibility
After building the reports, they are deployed through Power BI Service, making them accessible across the organization.
This allows teams to view and interact with dashboards in real time, ensuring that decisions are based on the most up-to-date information.

Collaboration becomes easier, as multiple stakeholders can access the same source of truth without duplication or inconsistency.
Performance Optimization with Direct Lake
To improve performance, Direct Lake connectivity is implemented. This allows Power BI to read data directly from storage without relying on scheduled refreshes.
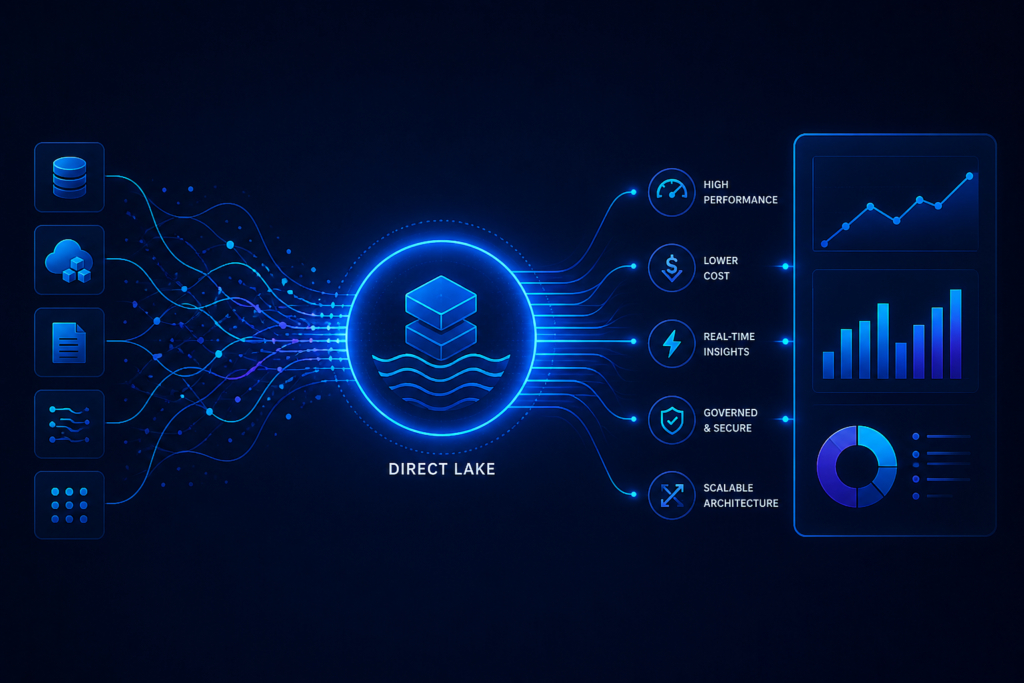
As a result, dashboards update almost instantly, reducing latency and eliminating bottlenecks.
This approach significantly enhances the responsiveness of the system, especially when dealing with large datasets.
Technical Challenges and Solutions
During implementation, several challenges were addressed to ensure system stability and efficiency.
Authentication reliability was improved to allow seamless and automated access to data sources without repeated logins.

Data retrieval performance was optimized using advanced techniques such as V-Order and Z-Ordering, which improve query speed and efficiency.
Schema drift was handled through automated detection and adaptation, ensuring that reports remain stable even when the underlying data structure changes.
Governance and Security
A strong governance framework was implemented to ensure data security and performance.
Heavy data processing tasks were shifted to PySpark, reducing the computational load on Power BI and improving overall efficiency.

Row-Level Security (RLS) was applied to control data access, ensuring that users can only view the information relevant to them.
This combination of performance optimization and security ensures that the system remains both efficient and compliant.
Business Impact
This implementation transforms the way organizations interact with data.
Instead of relying on manual reporting, businesses gain access to real-time insights that support faster and more informed decision-making.
The system creates a scalable foundation that can support future growth, advanced analytics, and integration with AI-driven solutions.
Key Takeaway
Power BI is not just a visualization tool. It is a complete data system that connects sources, applies logic, and delivers insights in a structured and scalable way.
When implemented correctly, it enables organizations to move from reactive reporting to proactive decision-making.